

First, and most important, the main saloon hatch leaked. But, there's also this issue of preserving data from the old chart plotter. You know how some projects just spin out of control? Those are the projects that tend to dredge up historical artifacts.
Here's the lens, carefully cut out of the hatch.
The residual Silicone adhesive/sealant needs to be ruthlessly cleaned from the lens and the aluminum frame.
What you find when you scrape the goo is places like this.

The goo is thin and crackly here. It has dried out, allowing water to intrude. A few freeze-thaw cycles and you've got a right big place for water to intrude.
The water brings dirt. The silicone at the place of the intrusion is clearly thinner and dirtier. And stiffer.
It's hard to tell by looking at the top of the lens. It's more than hard, it's nearly impossible. You might be able to carefully probe the rubber for crispiness, but I tried this a few weeks ago, and it seemed good and rubbery.
Memorial Day weekend, however, it rained like hell. CA stood under the hatch and watched it drip. This provided ample evidence that it was weeping through the silicone edge and then dripping down onto the aluminum frame and from there wandering to the low point (usually forward port corner) to drip.
Historical Detour
How does this repair spin out of control? It didn't. What spins out of control is the things I was doing while CA was working.
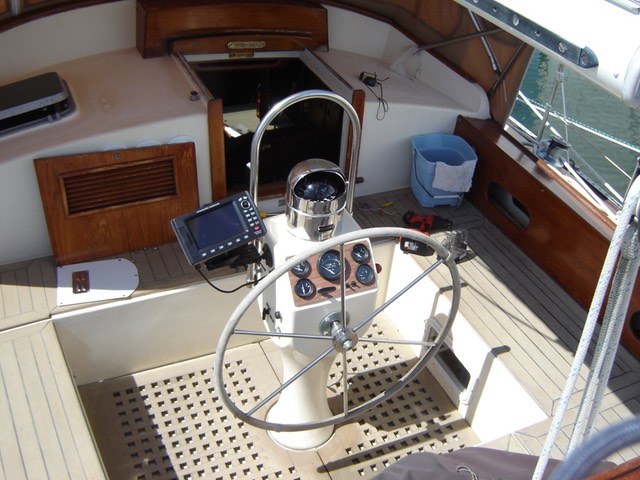
Back in 2010, I installed a Standard Horizon CP300i chart plotter. It's the little black screen with a row of gray buttons to the port side of the helm.
It's an elegant unit. It can stand alone, doing everything from it's internal GPS antenna. Almost no wiring to speak of.
I added a Standard Horizon GX2150 radio. It receives AIS message and forwards the details to the chart plotter to draw little pictures of approaching boats.
Do not leave home without it. It took us to the Bahamas and back.
That means it's packed full of routes and waypoints from the past six years of sailing.
I want that data.
An tangential question about preserving data is this: What was there before the Standard Horizon plotter? And What did I do to preserve it?
When we bought Red Ranger she came with an 90's vintage laptop running Windows 3 and some chartplotting software. There was a DB-9 cable that connected the computer's serial port to an ancient Garmin GPS receiver (with an LCD display of coordinates.)
The laptop had a few routes and waypoints. This is use information. How to preserve it?
What I did then was take the hard drive out of the laptop, mount it as an external drive, and copy the files for the chart-plotter application. It was easy to reverse engineer the data points, and convert the files to GPX. I loaded the points and routes into GPSNavX. I reformatted the hard drive and sold the computer as scrap on eBay. The Garmin went to Nauti Nell's to be sold on consignment. Or thrown away. Whatever. Hardware: Gone. Data: Captured.
Today's Problem
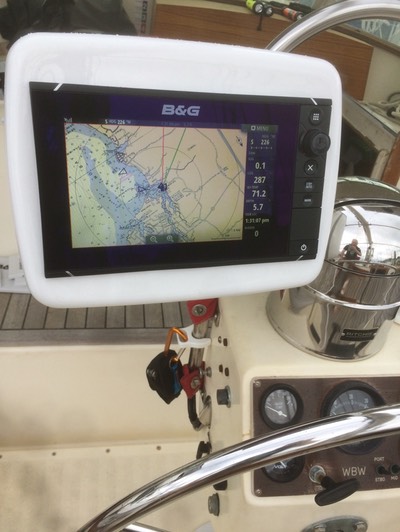
How do we get the data off this chart plotter and onto the new B&G Zeus2 9″ chart plotter? And the GPSNavX on my laptop, too?
Option 1. An NMEA-0183 to NMEA-2000 bridge of some kind. The Actisense NGW-1 seems to be the product of choice. This allows the SH to repeat the B&G instruments. That's kind of cool. In the long run, $179 seems like a low price to pay for this.
Option 2. One-time-only extract. This involves a $60 adapter I already had in a pile of parts. It gets data onto the laptop, which is step 1. From there to the chart plotter is an easier step 2.
The interesting problem is that you can't just "upload" or "download" waypoints. The NMEA-0183 protocol is old and simplistic. It involves wiring up a harness, installing a generic USB driver, and then using Python and the pyserial package to see what data traffic is flowing over the wire.
The details are — perhaps — interesting. They're not really suitable for a blog post here, because it wanders far from boats and boating and Red Ranger. It's better covered in my other blog, S.Lott-Software Architect. That other blog is about software and Python and stuff.
It's a lot of code. Too much for one blog post. That means it needs to be posted someplace like Git Hub. See slott56/NMEA-Tools.
Wait. What?
Yes. I captured the data points from the old chart plotter.
Then I wanted to write a blog post here. But it's too big and software-y.
To write a blog post, I had to put the code on Git Hub.
To put the code on Git Hub, I had to create a properly finished product with documentation and installation information and everything.
Just to save the waypoints and load them onto the new chart plotter.
That's how a project spins out of control.